
The Latest from Corn and Soybean Digest
thumbnail
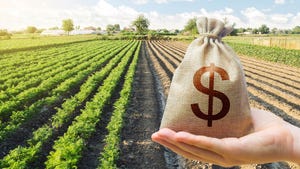
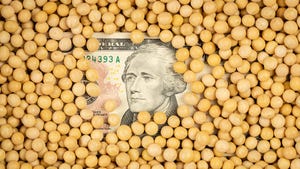
Farm BusinessWorking capital analysis for your farm businessWorking capital analysis for your farm business
Keep in mind: Top-level managers maintain working capital to expenses at a level of 50 percent, or about one half of the year’s expenses.


Market Overview
| Contract | Last | Change | High | Low | Open | Last Trade |
|---|---|---|---|---|---|---|
| Jul 24 Corn | 442.75 | -1.5 | 445.25 | 440.25 | 444 | 09:39 PM |
| May 24 Oats | 346 | -11.75 | 361.75 | 345 | 357.5 | 09:38 PM |
| May 24 Class III Milk | 17.29 | -0.02 | 17.29 | 17.25 | 17.25 | 11:09 PM |
| Jul 24 Soybean | 1160 | -12 | 1177.25 | 1158 | 1171.5 | 09:37 PM |
| Aug 24 Feeder Cattle | 252.35 | +2.575 | 252.6 | 248.6 | 250.025 | 06:04 PM |
| May 24 Ethanol Futures | 2.161 | unch — | 2.161 | 2.161 | 0 | 09:38 PM |

Copyright © 2019. All market data is provided by Barchart Solutions.
Futures: at least 10 minute delayed. Information is provided ‘as is’ and solely for informational purposes, not for trading purposes or advice.
To see all exchange delays and terms of use, please see disclaimer.
All Corn and Soybean Digest


.jpg?width=300&auto=webp&quality=80&disable=upscale)


Enter a zip code to see the weather conditions for a different location.
Recommended


Feb 22 - Feb 24, 2024
Feb 22 - Feb 24, 2024
The New York Farm Show is the leading farm show in the Northeast since 1985.
LEARN MORESubscribe to receive top agriculture news
Be informed daily with these free e-newsletters