
The Latest from Corn and Soybean Digest
thumbnail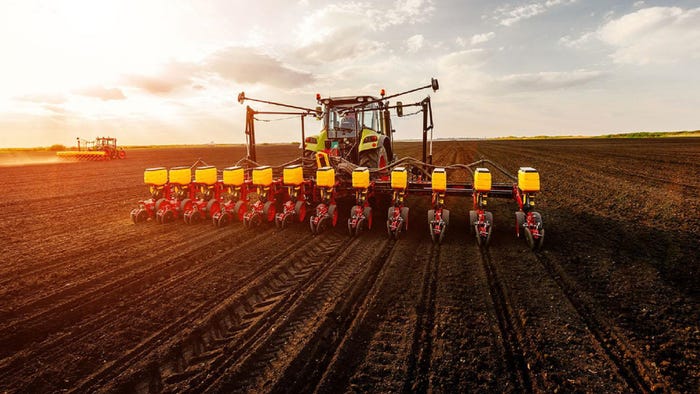
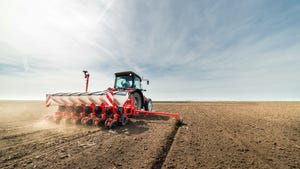
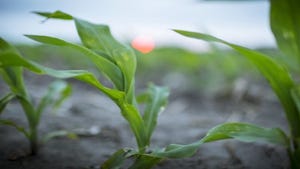
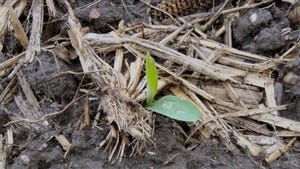
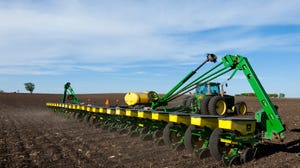
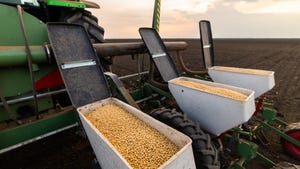
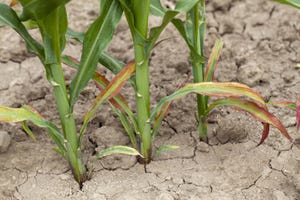
PlantingPlanting season do’s and don’tsPlanting season do’s and don’ts
Tips for enduring variable weather and playing the waiting to plant corn and soybeans in the Midwest.

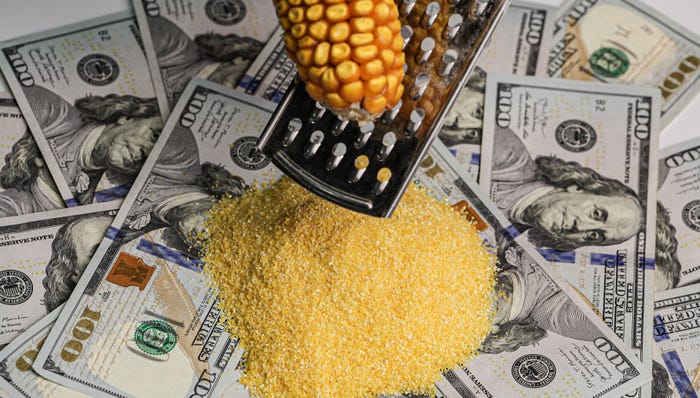

Market Overview
| Contract | Last | Change | High | Low | Open | Last Trade |
|---|---|---|---|---|---|---|
| Jul 24 Corn | 450.25 | +0.5 | 452.5 | 448.75 | 449.5 | 10:58 AM |
| Jul 24 Oats | 356 | +3.25 | 357.25 | 351 | 351 | 10:28 AM |
| May 24 Class III Milk | 18.35 | -0.03 | 18.35 | 18.3 | 18.34 | 09:46 AM |
| Jul 24 Soybean | 1178.25 | +1.75 | 1184.25 | 1173.25 | 1176.5 | 10:58 AM |
| Aug 24 Feeder Cattle | 258.475 | +4.975 | 259.5 | 255.675 | 256 | 06:04 PM |
| May 24 Ethanol Futures | 2.161 | unch — | 2.161 | 2.161 | 2.161 | 09:39 PM |

Copyright © 2019. All market data is provided by Barchart Solutions.
Futures: at least 10 minute delayed. Information is provided ‘as is’ and solely for informational purposes, not for trading purposes or advice.
To see all exchange delays and terms of use, please see disclaimer.
All Corn and Soybean Digest


.jpg?width=300&auto=webp&quality=80&disable=upscale)


Current Conditions for
Boone, IA
54°F
Mostly Cloudy
Day 64º
Night 51º
5.87 mph
Enter a zip code to see the weather conditions for a different location.
Recommended


Aug 27 - Aug 29, 2024
Aug 27 - Aug 29, 2024
The nation’s largest outdoor farm event that annually hosts over 600 exhibitors from around the world.
LEARN MORESubscribe to receive top agriculture news
Be informed daily with these free e-newsletters